Chapter 6: Know Your Numbers Before They Know You
Chapter 6

Know Your Numbers Before They Know You

Mike's business was busier than it had ever been. Systems were holding. His technician wasn't texting him ten times a day anymore. Jobs were getting booked, done, and closed out without Mike personally touching every single one. By every feeling in his gut, things were good.

The Challenge

Almost every contractor uses the same instrument to judge business health: the checking account. If there's money in it, things are good. If it's tight, something's wrong. It's simple, it's honest, and it's also months behind reality — because by the time a problem shows up in the bank balance, it's already been building for weeks.

A full schedule feels like success. It can just as easily be the sound of a business working very hard to lose a little money on every job, one truck at a time. Profitable-looking companies fail every year — not because the owner didn't work hard enough, but because nobody was listening to the business until the bank account finally had no choice but to say something.
Why It Happens

Most contractors never learned to read numbers because nobody ever showed them how, and the whole subject sounds like it belongs to an accountant, not a tradesperson. That fear is exactly backwards. You don't need a spreadsheet to run a business. You need visibility — a handful of numbers that let you hear what the business has been telling you all along.

Businesses rarely collapse overnight. The numbers usually whisper long before they scream. A full schedule and a happy gut feeling are both lagging signals of effort, not performance. Effort tells you how hard you worked. Performance tells you whether the work was worth it — and a contractor can work harder than ever while actually going backward, because busy and profitable are two different words that only sound like they mean the same thing.

Profit is an outcome. Numbers are the steering wheel that gets you there — or doesn't.

Common Mistakes

Judging the business by the bank balance alone.

Cash in the account reflects decisions made weeks or months ago. It tells you almost nothing about whether this week's jobs were priced and run correctly.

Assuming "busy" means "profitable."

A full truck can be running at a loss just as easily as a profit, especially once callbacks, wasted material, and drive time get counted honestly.

Avoiding numbers because they feel like an accusation.

The numbers aren't judging you. They're trying to help you.

Tracking too much or nothing at all.

Some contractors avoid numbers entirely. Others try to track forty metrics at once, get overwhelmed, and quit within a month. Both end in the same place: no usable information.

The Framework: The Owner's Dashboard

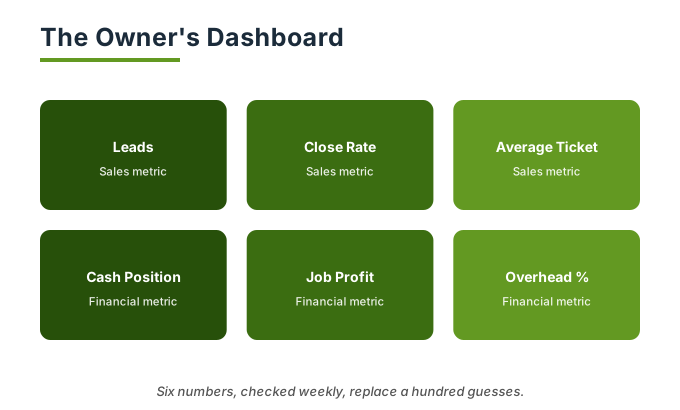
The Owner's Dashboard

Six numbers. That's the whole dashboard. Three about getting the work, three about keeping the money — simple enough to sketch on a napkin, which is exactly how Mike ended up building his.

1

Leads Generated

How many new potential customers contacted you this week? This is the fuel going into the business. If this number drops, everything downstream drops with it eventually, even if this week's schedule still looks full.

2

Close Rate

Of the estimates you gave, what percentage turned into booked jobs? A close rate under 40% on jobs that match your niche from the FIT Filter usually points to a pricing or trust problem, not a market problem.

3

Average Ticket

What's the average dollar value of a completed job? A flat or falling average ticket while your hours worked keep climbing means you're getting busier without getting more valuable.

4

Gross Profit Per Job

Revenue minus labor and material cost, per job. This is the number Mike didn't have an answer for at coffee. Without it, "the truck is full" and "the truck is making money" are just two unrelated sentences that happen to sound similar.

5

Callback Rate

What percentage of completed jobs required a return visit to fix something? A rising callback rate on jobs run by newer employees isn't a personnel problem yet — it's a Repeatability Rule problem from Chapter 5 waiting to be solved.

6

Cash Available

Not your bank balance today — your bank balance minus every bill, payroll obligation, and tax set-aside you already owe. Cash available shrinking while revenue is climbing almost always means a collections problem, a pricing problem, or both.

What gets measured gets improved. Not because the number itself fixes anything, but because a number you're watching every week turns a vague feeling into a specific decision.

Real Contractor Example

Mike built his dashboard that weekend on a single sheet of paper taped inside his truck's glovebox. Leads, close rate, average ticket — all reasonable. Then he worked backward through two weeks of invoices to find his gross profit per job, and one number stopped him cold.

After-hours emergency calls — the service he was proudest of, the one he bragged about at family barbecues — were barely breaking even. Once he counted his technician's night-rate pay and the wasted trips for jobs that turned out smaller than described, his "signature" service was making him almost nothing.

He repriced after-hours calls that same week. Not because a spreadsheet told him to — because one honest number showed him something his gut, busy congratulating itself on a full schedule, had never once suspected.

Sarah had learned the same lesson two years earlier, the hard way — a "great year" on paper that turned into a scramble to make payroll every March, because she'd never separated revenue from cash she actually had available. The bank account had been lying to her, politely, the entire time.

Action Checklist

  • Tape a single sheet of paper somewhere you'll see it daily — glovebox, office wall, wherever works.
  • Write down last week's numbers for all six: Leads, Close Rate, Average Ticket, Gross Profit Per Job, Callback Rate, Cash Available.
  • Circle the one number that surprised you most.
  • Pick one small action this week aimed directly at improving that one number.
  • Commit to updating the dashboard weekly, at the same time each week, for the next month before adding anything else to track.

Key Takeaways

A full schedule and a good feeling are not the same thing as a healthy business — they're lagging signals of effort, not proof of performance. The Owner's Dashboard — Leads, Close Rate, Average Ticket, Gross Profit Per Job, Callback Rate, and Cash Available — turns a vague sense of "things are good" into six specific numbers you can act on. Systems from Chapter 5 create consistency; these six numbers tell you whether that consistency is actually working. Businesses rarely collapse overnight. The numbers whisper first. Your job is to be listening before they have to scream.

Reflection Questions

If Sarah asked you right now which jobs made money last month, could you answer without guessing? Which of the six numbers do you suspect would surprise you most if you actually tracked it this week? Are you currently managing effort, performance, or neither? What's the smallest version of a dashboard you could start keeping tomorrow morning?


Knowing your six numbers tells you whether the business is healthy. It doesn't yet tell you where the money actually goes once it comes in — and for most contractors, that's the part that quietly determines whether a good year on paper turns into a good year in the bank. Chapter 7 is where we follow the money all the way through.

Scroll to Top